Stop Tracking Vanity Metrics: The 7 Numbers That Prove Marketing Works (2026)
Pageviews and likes do not pay salaries. The 7 metrics that tie marketing spend to revenue in 2026, with attribution frameworks and the dashboard setup most teams get wrong.

Stop tracking vanity metrics. Learn the 7 key metrics to measure marketing effectiveness in 2026, plus frameworks for ROI attribution and campaign optimization.
Measuring marketing effectiveness isn't about tracking vanity metrics or seeing who can spend the most. It's about drawing a straight line from every marketing dollar to a real business outcome, things like revenue, customer acquisition, and brand health.
This means shifting your mindset from simply being busy to being impactful.
What Marketing Effectiveness Actually Means
Before you can measure it, you have to know what you're looking for. Marketing effectiveness is a cold, hard assessment of how well your efforts are hitting those big-picture business goals. We're talking about something that goes way beyond counting likes, shares, or even website traffic.
It's easy to fall into the trap of celebrating "vanity metrics", numbers that look impressive on a report but have zero correlation with business success. A sudden spike in social media followers is completely meaningless if none of them ever become paying customers.
The core question has to change. Stop asking, "Are we doing a lot of marketing?" and start asking, "Is our marketing actually moving the needle for the business?" This distinction is everything.
Shifting Focus From Volume To Value
The smartest marketers I know consistently prove that intelligent spending crushes massive spending every single time. It's not about the size of your budget; it's about how you use it.
Look at Procter & Gamble. They famously cut $200 million in digital ad spend they identified as having no real business impact. And what happened? Nothing. Their reach and effectiveness didn't even dip. By simply re-focusing on the channels that actually worked, they boosted their overall efficiency without the wasted spend.
JPMorgan Chase had a similar lightbulb moment. They found their ads were showing up on a staggering 400,000 different websites. By slashing that list down to just 5,000 high-quality sites, a 99% reduction, they maintained campaign performance while cutting costs and protecting their brand from appearing in the wrong places.
Key Pillars Of Marketing Effectiveness
To build a measurement framework that actually works, you need to zero in on a few pillars that connect your daily actions to real, tangible results. This ensures you're not just tracking activity, but progress that drives the business forward.
To measure what truly matters, your strategy should be built on three core pillars that connect marketing activities directly to business outcomes. This framework helps you move beyond surface-level metrics and focus on what drives growth.
| Pillar | Focus Area | Example Business Outcome |
|---|---|---|
| Financial Impact | How marketing dollars translate into revenue. | Increased Return on Investment (ROI) and higher Customer Lifetime Value (CLV). |
| Customer Growth | The ability to attract and retain customers profitably. | Lower Customer Acquisition Cost (CAC) and improved customer retention rates. |
| Brand Health | The market's perception and awareness of your brand. | A larger share of voice in the market and positive brand sentiment online. |
Focusing on these three areas ensures that every metric you track contributes to a bigger, more important story about your marketing's true value to the company.
-
Financial Impact: This is the big one. It directly measures how marketing contributes to the bottom line. You absolutely have to be tracking metrics like Return on Investment (ROI) and Customer Lifetime Value (CLV). No excuses.
-
Customer Growth: Are you actually bringing in new customers and keeping them around? This pillar tracks your ability to attract and hold onto your audience. Key metrics here are Customer Acquisition Cost (CAC) and, of course, retention rates. For a deeper dive, check out our complete guide to user retention metrics.
-
Brand Health: This one is a bit tougher to quantify, but it's a vital long-term indicator. It gauges how your brand is perceived in the market. Metrics like share of voice and brand sentiment tell you if you're building a brand that will last.
Choosing the Metrics That Actually Matter
It's a familiar feeling for every marketer: drowning in data. With countless metrics to track, it's all too easy to get bogged down in numbers that don't really tell you if your marketing is working. The secret isn't to track everything; it's to zero in on the vital signs that truly reflect the health of your business.
Forget what the industry benchmarks say for a second. The most powerful Key Performance Indicators (KPIs) are the ones tied directly to your business goals, not just the ones everyone else is measuring.
Aligning KPIs with Your Business Model
The right metrics look completely different depending on your business. An e-commerce brand's dashboard should look nothing like a B2B SaaS company's dashboard, and that's a good thing.
A direct-to-consumer e-commerce store, for example, should be obsessed with Customer Lifetime Value (CLV). This number tells them exactly how much a customer is worth over their entire relationship with the brand. Knowing your CLV lets you make much smarter decisions on ad spend. If the average CLV is $250, you can confidently spend more than a single purchase price to acquire a new customer, because you know you'll make it back over time.
On the other hand, a B2B SaaS company needs to focus on metrics that map to a much longer, more complex sales cycle. Their dashboard will probably highlight things like:
-
Marketing Qualified Leads (MQLs): The number of leads your marketing efforts have generated that are ready for the sales team.
-
Sales Qualified Leads (SQLs): The MQLs that the sales team has accepted and is actively trying to close.
-
Customer Acquisition Cost (CAC): The total cost of marketing and sales to bring in one new customer.
Getting a handle on your CAC is absolutely fundamental to scaling your business. If you're spending $5,000 to acquire a customer who will only ever pay you $3,000, you don't have a business model, you have a leaky bucket. To really dig in, check out this guide on how a customer acquisition cost calculator can give you these critical insights.
Your marketing dashboard should tell a story. If someone from outside your team can't look at it for 60 seconds and understand how you're performing, your metrics are too complicated.
From Vanity Metrics to Growth Levers
The real goal here is to find the numbers that act as genuine levers for growth. These are the metrics that, when you improve them, have a direct and predictable impact on revenue. Chasing vanity metrics like impressions or page views feels productive, but it rarely moves the needle on what actually matters.
A better way is to organize your metrics around the core stages of the customer journey. This helps you measure marketing effectiveness where it counts.
Key Growth Metrics by Funnel Stage
| Funnel Stage | Growth Metric | Why It Matters |
|---|---|---|
| Awareness | Share of Voice (SOV) | Measures your brand's visibility compared to competitors, showing your actual market presence. |
| Consideration | Click-Through Rate (CTR) | Shows how compelling your message is and if you're actually attracting the right people. |
| Conversion | Conversion Rate | The ultimate test of whether your marketing is persuading people to take the action you want. |
| Loyalty | Customer Retention Rate | Tells you how well your product and service keep customers happy and coming back for more. |
When you focus on these kinds of outcome-driven KPIs, you shift the conversation from "How much traffic did we get?" to "How much of our qualified traffic turned into revenue?" That's the foundation for making confident, data-backed decisions that create real, sustainable growth. Your dashboard stops being a report card and becomes your roadmap.
Building Your Modern Measurement Toolkit
Once you've nailed down your most important metrics, it's time to pick the right tools for the job. You can have the best strategy in the world, but without a solid tech stack to collect, organize, and analyze your data, you're basically flying blind.
Let's be clear: this doesn't have to be some overly complicated, enterprise-level setup. The goal is simple. You need a system that gives you reliable data, helps you understand what your customers are actually doing, and ultimately proves the value of every dollar you spend on marketing.
Foundational Analytics Platforms
Every good measurement toolkit starts with a central hub for your web and app analytics. For a lot of businesses, this is a platform like Google Analytics. It's the bedrock, giving you a comprehensive look at your website traffic, user behavior, and conversion tracking right out of the box.
These tools tell you the essentials: who's visiting your site, how they got there, and what they do once they arrive.
For instance, a quick glance at a typical Google Analytics dashboard can give you a powerful snapshot.
Right away, you can see how many users you had, how long they stuck around, and which channels like Organic Search or Direct traffic are your biggest drivers. This is your starting point.
The Rise of Privacy-First Measurement
The ground has shifted permanently. Third-party cookies are now fully deprecated across all major browsers, and a wave of global privacy regulations, from GDPR and CCPA to newer laws rolling out across Asia and Latin America in 2026, mean the old ways of tracking individual users are completely obsolete.
We're seeing Marketing Mix Modeling (MMM) become a mainstream tool, not just a fallback. When Apple rolled out its App Tracking Transparency framework in the early 2020s, it kneecapped advertisers' ability to track users across apps. By 2026, this privacy-first shift has fully matured, pushing teams to adopt MMM and other aggregated measurement approaches as their primary strategy rather than a secondary one. You can find more on this evolution over at Funnel.io.
A modern toolkit must be resilient. Relying solely on tools that need third-party cookies is like building a house on a foundation of sand. You need a mix of platforms that can weather the privacy-focused changes happening across the industry.
Choosing Your Core Tools
Beyond a foundational platform like Google Analytics, you'll need to layer in tools that solve specific problems across your funnel. The final stack really depends on your budget, team size, and what you're trying to achieve.
Here are a few categories I consider essential:
-
Customer Relationship Management (CRM): A good CRM like HubSpot or Salesforce is non-negotiable. It's the only way to connect the dots between a marketing touchpoint and an actual sale, giving you that full-funnel view.
-
Customer Data Platforms (CDP): Think of a CDP like Segment or Twilio as the central brain for all your customer data. It pulls information from your website, app, CRM, and other sources to build a single, unified profile for each customer.
-
Conversion Optimization Tools: This is where you turn data into action. Platforms like Humblytics are designed for this, giving you tools to run A/B tests, visualize conversion funnels, and use heatmaps to understand why users are bouncing instead of converting, all without relying on cookies or invasive tracking.
Picking the right combination is what separates the pros from the amateurs. To give you a head start, we put together a breakdown of the top analytics tools to transform your website performance. It'll help you build a toolkit that doesn't just measure what happened, but actively helps you make it better.
Creating a Single Source of Truth for Your Data
Relying on isolated channel reports is a recipe for disaster. That glowing report from your email platform is completely misleading if it doesn't tell you those customers first clicked on a paid ad. Likewise, your social media analytics will never show you which followers eventually became high-value offline customers.
You only get the real story when you can see the entire customer journey, not just disjointed snapshots.
The biggest hurdle for most marketing teams? Data silos. Your data is scattered everywhere, your CRM, Google Ads, website analytics, social platforms, and each one tells a slightly different part of the story. The goal is to weave these threads together into a single, cohesive narrative. This is your single source of truth.
Unifying Your Data Streams
Building this unified view is an active process of integrating your various data sources. It's about connecting your website analytics with your CRM data to see which blog posts are actually attracting leads that close deals. It's about feeding ad platform data into your central analytics to finally understand how different campaigns influence one another.
This integrated approach lets you answer the questions that really matter:
-
How many touchpoints does a customer typically have before they convert?
-
Which channels are best at introducing new customers versus sealing the deal?
-
What's the true cost to acquire a customer when you factor in every single interaction?
If you're looking to really dig into interpreting this kind of unified data, diving into resources on mastering data analysis for marketing success can be a game-changer. This isn't just about collecting data; it's about turning it into a strategic asset that guides every single decision you make.
When your data is unified, you stop making decisions based on which channel shouts the loudest. Instead, you make holistic choices based on a complete picture of what drives growth.
Visualizing Cross-Channel Performance
Once you have a more integrated view, you can finally start comparing channel performance on an apples-to-apples basis, like ROI. This kind of side-by-side comparison is where the insights really start to pop.
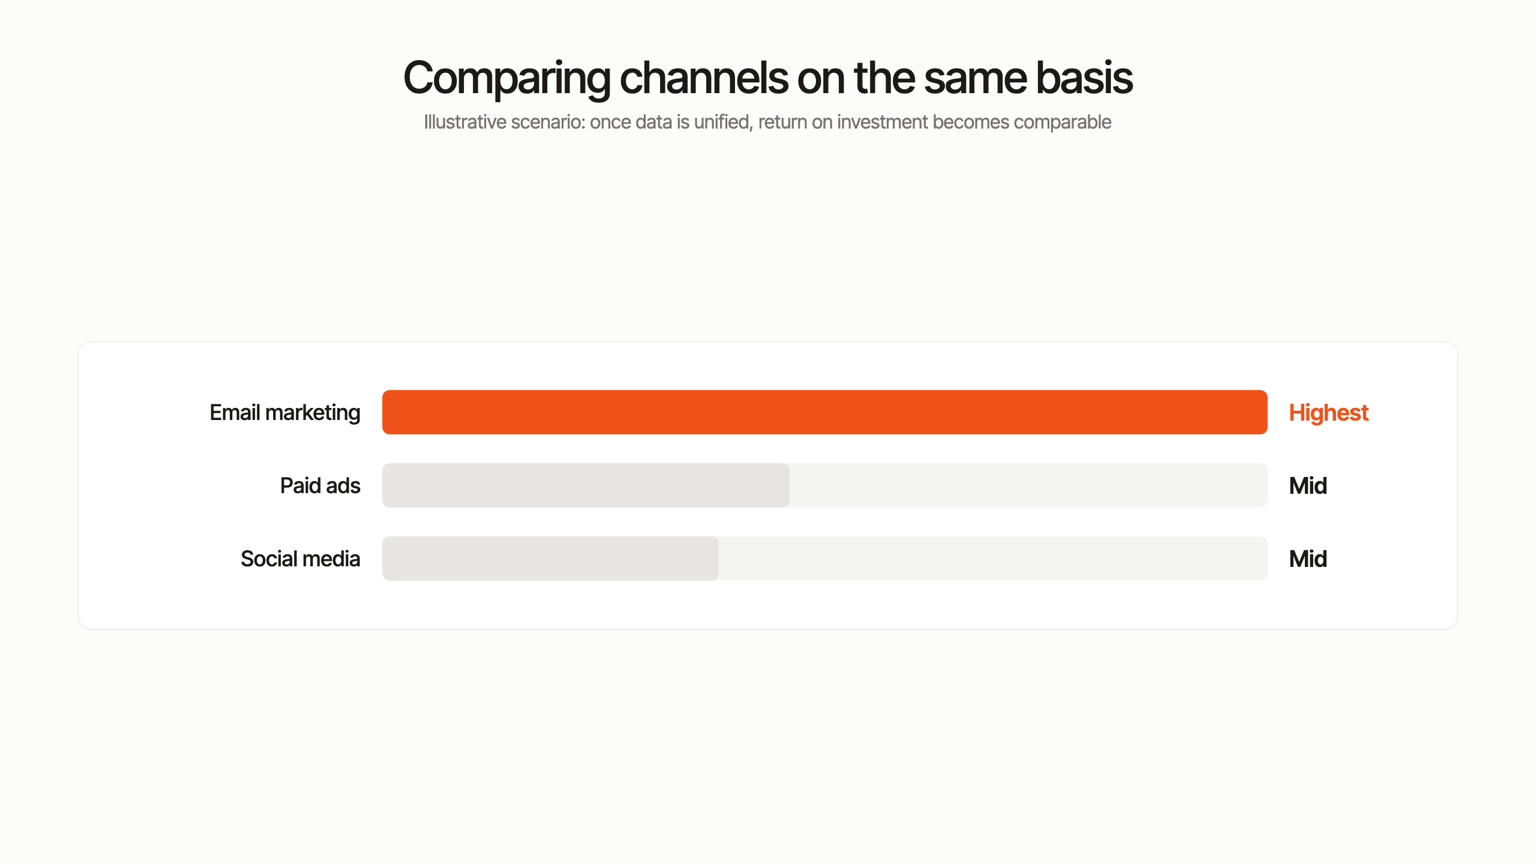
This visualization makes it immediately obvious that while paid ads and social media are pulling their weight, email marketing is delivering a wildly higher ROI in this particular scenario.
Preparing for a Privacy-First Future
Getting your data house in order is more critical than ever as privacy-first measurement becomes the default, not the exception. The future of measurement is built on durable tools that can connect various dimensions of customer interaction without relying on third-party cookies.
This multi-dimensional approach is what will allow marketers to pinpoint the channels and KPIs that genuinely move the needle. By focusing now on resilient data quality and privacy-safe unification, you can better predict your marketing ROI and adapt to increasingly complex purchase paths.
Turning Your Insights into Smarter Actions
Let's be honest, collecting data is the easy part. The real work, the stuff that actually grows your business, is turning those numbers into action. A dashboard full of charts is worthless if it doesn't lead to smarter decisions. This is where you close the loop, translating what you've learned into real-world improvements that actually hit the bottom line.
Measuring your marketing effectiveness is pointless until you actually do something with the results. Think of it as a continuous feedback loop. This is the engine that drives high-performing marketing teams, making sure you're always learning, adapting, and getting better.
Double Down on What Works, Ditch What Doesn't
Your data is going to show you clear winners and losers. The trick is to act on that information decisively. That means shifting your budget and effort away from the campaigns that are dragging you down and pouring fuel on the ones that are delivering the best results. This isn't about admitting failure; it's about being agile.
Picture this: you're looking at your paid search data and see one ad set has a ridiculously high Cost Per Acquisition (CPA) with hardly any conversions. At the same time, another campaign aimed at a different audience is bringing in high-quality leads for half the price. The move is obvious: pause the expensive, underperforming ads right now and put that money behind the winner.
This thinking goes beyond just the budget. It applies to your creative, too. If your data shows a landing page has a 75% bounce rate, that's a massive red flag. Your next step isn't just to note it down; it's to launch an A/B test with a punchier headline or a simpler contact form.
Build a Culture That Runs on Data
For any of this to stick, measurement has to be woven into your team's DNA. It means shifting away from "I think" and "my gut says" and moving toward a culture where data starts the conversation.
The best teams don't see data as a report card to be judged on. They see it as a roadmap showing them where to go next. It's a tool for curiosity and improvement, not for placing blame.
So, how do you make that shift? Start by making data easy for everyone to access and understand. Set up simple, automated reports that get shared with the whole team. Then, in your meetings, frame the discussions around the numbers. Ask questions like:
-
What is this metric really telling us about our customers?
-
What's the story behind this trend? Why did it happen?
-
Based on this data, what's one thing we should test next week?
When you consistently link data back to strategic decisions, you empower everyone on the team to think like an analyst. They'll start spotting opportunities on their own and bringing data-backed ideas to the table. That's the real goal here: creating a system that gets smarter and more effective all on its own.
Common Questions About Marketing Measurement
Even with the best framework, theory only takes you so far. When you get down to the nitty-gritty of measuring your marketing, real-world questions always pop up. Let's tackle some of the most common ones we hear from marketers who are putting these ideas into practice.
These are the kinds of day-to-day challenges that can trip you up, but getting them right is what separates a good data-driven strategy from a great one.
How Often Should I Measure My Marketing Effectiveness?
The honest answer? It completely depends on what you're looking at.
For your fast-paced channels, think paid search or social media ad campaigns, you need to be checking in daily or at least weekly. This is where you can spot trends early, kill underperforming ads before they burn through your budget, and quickly reallocate spend to what's actually working.
But for the bigger, slower-moving metrics like brand health, SEO rankings, or Customer Lifetime Value (CLV), a monthly or even quarterly review makes a lot more sense. These numbers don't shift overnight. Checking them too often will just make you paranoid, leading to knee-jerk reactions based on tiny, meaningless fluctuations. Find a rhythm that lets you make smart adjustments without getting lost in the noise.
Don't mistake constant monitoring for effective measurement. The goal isn't to stare at a dashboard all day; it's to review data at a cadence that allows for thoughtful, strategic action.
What Is the Difference Between Marketing ROI and ROAS?
It's easy to get these two mixed up, but they tell you very different stories. Think of them as different zoom levels for viewing your performance.
Return on Ad Spend (ROAS) is the tactical, close-up view. It's laser-focused on a specific ad campaign and tells you the gross revenue you generated for every dollar you spent. The formula is simple: Revenue / Ad Cost. This metric answers the question, "Is this particular ad profitable?"
Marketing Return on Investment (ROI), on the other hand, is the wide-angle, panoramic shot of your entire marketing department. It measures the overall profitability of your strategy by factoring in all the costs, salaries, software, overhead, the works. The formula is: (Sales Growth - Marketing Cost) / Marketing Cost.
ROAS tells you if an ad is working. ROI tells you if your marketing team is a profitable part of the business.
How Can I Measure Offline Marketing Campaigns?
This is a classic challenge. How do you track the impact of a print ad, a piece of direct mail, or a sponsorship at a trade show? The key is to build a digital bridge, a clear, trackable path from the physical world to your website.
Here are a few proven ways I've seen work time and time again:
-
Unique URLs: Create a custom, easy-to-remember landing page just for that campaign. Think
yourwebsite.com/eventinstead of your generic homepage. -
Dedicated Phone Numbers: Use a call-tracking service to assign a unique phone number to each ad or mailer. Now you know exactly which piece made the phone ring.
-
QR Codes: Add a QR code that sends people straight to a specific offer page. It's a simple, direct link from their phone to your funnel. In 2026, QR code scanning is second nature for most consumers, making this one of the most reliable offline-to-online bridges.
-
Post-Purchase Surveys: Never underestimate the power of just asking. A simple "How did you hear about us?" dropdown at checkout can uncover invaluable attribution data.
These methods help connect the dots, allowing you to attribute website traffic, leads, and sales back to your offline campaigns so you can finally see their true value.
Ready to stop guessing and start knowing what drives revenue? Humblytics gives you the tools to visualize funnels, run A/B tests, and attribute every dollar to the right campaign, all without compromising user privacy. See where you're losing customers and learn how to win them back. Discover how Humblytics can transform your marketing effectiveness today.
Stop optimizing for clicks Google cannot bill you for.
Connect Meta, Google, and Stripe in one click. See per-channel ROAS in dollars, not clicks. MatchDay Health 6x revenue after wiring this up.