Website Traffic Analysis: The 6-Step Method That Beats GA4 Dashboards (2026)
Most traffic dashboards hide the answers. The 6-step method to find your highest-converting source, your worst-performing page, and your real bounce reasons. Free tools included.

Website Traffic Analysis: The 6-Step Method That Beats GA4 Dashboards (2026)
Learn how to analyze website traffic effectively in 2026. Discover key metrics, privacy-first strategies, and modern tools to boost your website's performance and grow your business.
Before you can really dig into your website traffic, you need to get two foundational pieces right: understanding where your visitors are coming from and setting crystal-clear goals that actually matter to your business.
This is the bedrock of good analysis. It's what turns a jumble of raw data into a strategic roadmap for growth. It's about knowing the difference between traffic from organic search, direct visits, and paid ads, and then defining what a "win" actually looks like, whether that's more leads, higher sales, or just getting more people to stick around.
Building Your Foundation for Traffic Analysis
Jumping straight into charts and spreadsheets without a plan is a recipe for disaster. It's like sailing without a map; you'll just drift aimlessly through data points, making zero real progress. The goal isn't just to see numbers go up. It's to understand the story those numbers are telling about your audience and your business.
This means we have to look past the vanity metrics. Sure, a big spike in pageviews feels good, but it's completely meaningless if none of those visitors are taking the actions you care about.
Understanding Your Traffic Sources
Every single visit to your website has an origin story. Knowing where people come from is the first real step in your analysis because it tells you which of your marketing channels are pulling their weight.
-
Organic Search: These are the visitors who find you through a search engine like Google. High organic traffic is usually a great sign that your content is relevant and your SEO is in good shape.
-
Direct Traffic: This is your core audience, people who type your URL straight into their browser. They often include your most loyal customers and people who already know and trust your brand.
-
Referral Traffic: Visitors who click a link from another website to land on yours. A strong referral source can be a massive vote of confidence and a powerful endorsement.
-
Paid Campaigns: This is traffic you pay for, like from Google Ads or social media promotions. Here, you're paying for every click or impression, so tracking ROI is critical.
Setting Measurable Goals
Once you have a handle on where your traffic is coming from, you need to decide what you want those visitors to do. Vague goals like "get more traffic" are pretty much useless. You need to get specific and set measurable objectives.
For instance, a much better goal would be: " Increase organic traffic to our main product page by 15% this quarter to generate 50 new qualified leads." For more on this, check out our guide to a better web analytics dashboard to see how clear goal-setting can completely change your reporting.
When you tie your analysis to concrete business outcomes, you ensure every effort is focused squarely on what drives your bottom line.
A well-defined goal acts as a filter. It helps you tune out all the distracting noise and focus only on the data that signals real progress toward what your business actually needs.
This whole process is about connecting the dots, from the source of the traffic, to a measurable goal, and finally to your core business outcomes.
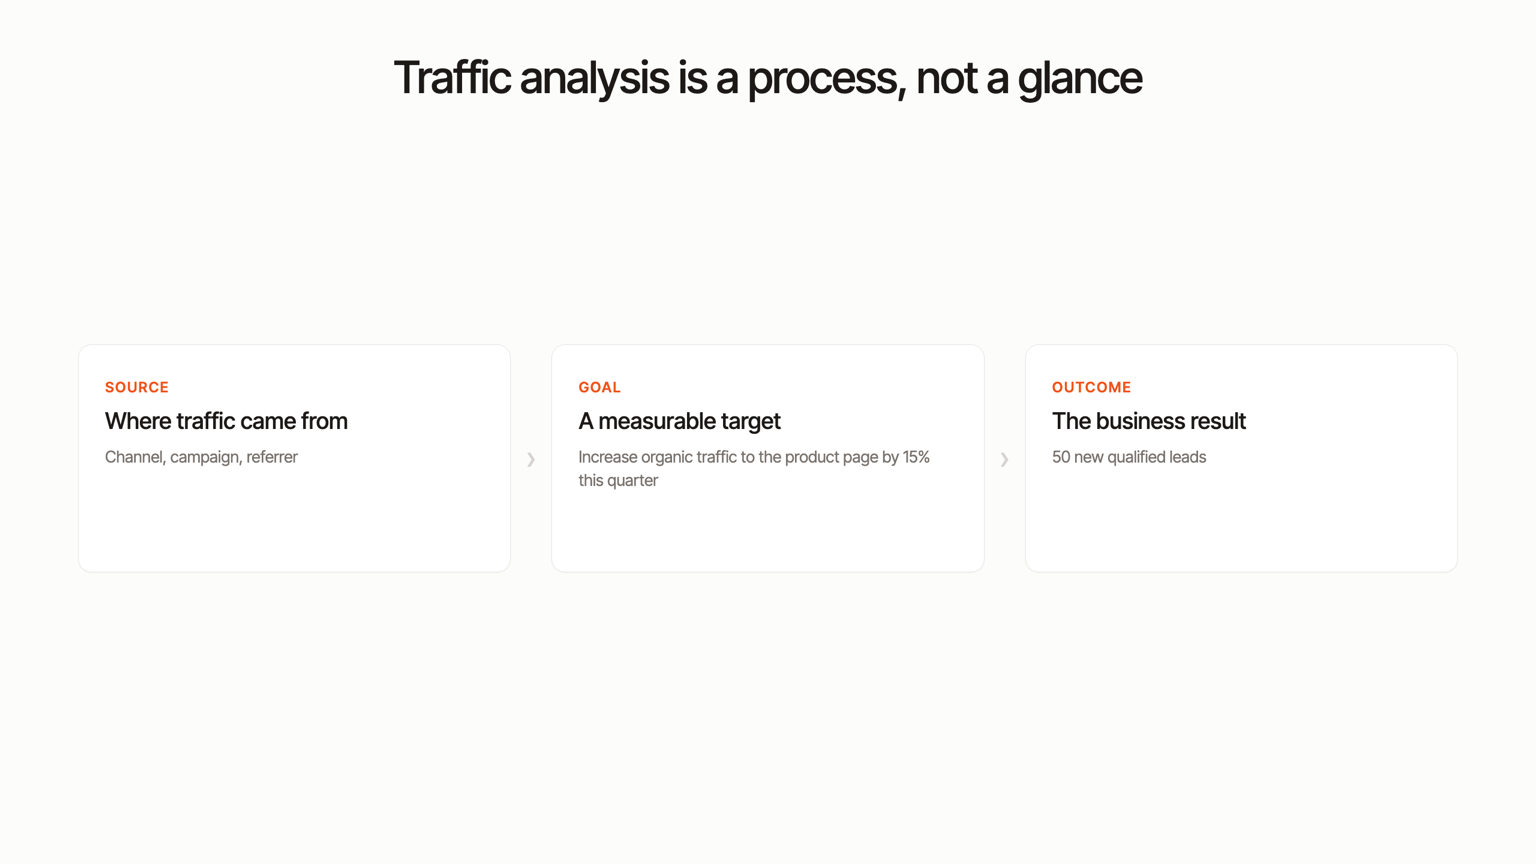
As you can see, successful analysis is a strategic process from start to finish. It's not just about glancing at a bunch of disconnected numbers.
Setting Up Your Analytics Toolkit Correctly
Garbage in, garbage out. It's an old saying, but it's the absolute truth when it comes to web analytics. Before you can dream of analyzing traffic and optimizing funnels, you have to get the data collection right. For many teams, that still starts with Google Analytics 4 (GA4), though in 2026, privacy-first alternatives like Humblytics are rapidly gaining ground thanks to cookieless tracking and simpler setup.
But this isn't just about copying and pasting a tracking code and calling it a day. The initial setup is your one and only chance to build a foundation of clean, trustworthy data that actually reflects your business goals. A few extra minutes here will save you from months of headaches and bad decisions down the road.
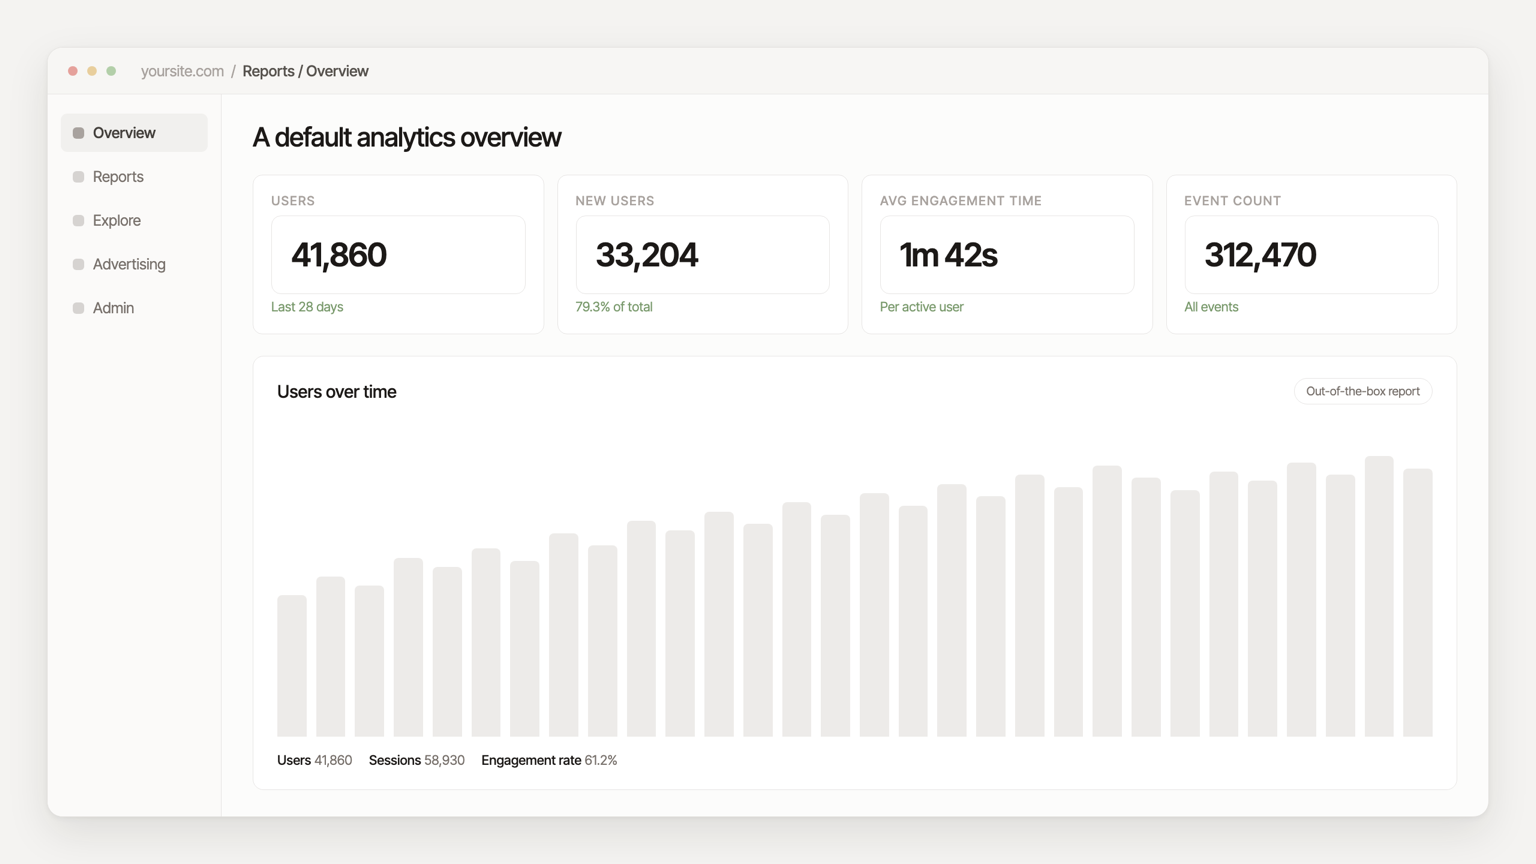
Sure, the default GA4 dashboard gives you a nice little overview of users and engagement time. But that's just the tip of the iceberg. To get real answers, you need to tell it what to look for.
Your First Critical Configuration Steps
Once you have the tracking code on your site, the real work begins. It's tempting to skip these next few steps, but doing so means your data will be a messy mix of real customers, your own team, and bots.
First up, filter out your internal traffic. Your team, your developers, and your marketing agency are all over your site. That's great, but their sessions aren't real customer behavior. Go into your analytics settings and define the IP addresses of your offices and remote team members to exclude them. This one simple action stops you from inflating session counts and completely skewing engagement metrics. (With Humblytics, internal traffic filtering is built in, just add your team's IPs in Settings and you're done.)
Next, you absolutely must define your conversion events. A "conversion" isn't just a visit; it's the action that matters to your business. It's the finish line.
Don't just track pageviews. A conversion is what moves the needle for your business. It's a submitted form, a product purchase, a newsletter signup, or a demo request. By setting these up as formal events, you can directly measure the effectiveness of your website.
Properly configured conversions let you see which traffic sources are driving valuable actions, not just clicks. You might discover that while Instagram sends a ton of traffic, organic search is quietly delivering 75% of your qualified leads. That's the kind of insight that changes where you put your money.
Ensuring Data Privacy and Future-Proofing
While you're under the hood, now is the perfect time to think about data privacy. With regulations getting stricter globally, the EU's ePrivacy Regulation, evolving US state-level privacy laws, and browser vendors continuing to phase out third-party cookies, old-school tracking methods are a liability. Understanding and implementing a proper user consent framework is no longer optional; it's a core part of a modern analytics setup.
It's also smart to look ahead. As you're getting everything configured, it's worth learning more about how to implement cookieless analytics in 2026. This will help you stay compliant and maintain data accuracy as the web continues to evolve. Tools like Humblytics are built for this reality, no cookies, no consent banners, full compliance out of the box.
Getting this initial setup right, from filtering your own team's traffic to defining what a "win" looks like, is non-negotiable. It's what transforms your analytics tool from a glorified hit counter into a powerful engine for smart business decisions.
Decoding the Metrics That Actually Matter
Alright, you've got your analytics set up and data is starting to roll in. Now for the fun part: figuring out what it all means.
Opening your analytics dashboard for the first time can feel like you're trying to read a foreign language. Charts, graphs, and numbers are all competing for your attention. The trick isn't to understand every single data point at once. It's about zeroing in on the core metrics that tell you the real story behind what your visitors are doing.
Think of yourself as a detective. Each metric is a clue, and when you piece them together, a clear picture emerges of what's really working, and what's not. Let's ignore the vanity metrics for now and focus on the numbers that actually move the needle.
The Core Four Traffic Metrics
To get started, let's break down the foundational metrics you'll see in tools like Google Analytics 4 (GA4) or Humblytics. Getting a grip on the nuances between them is your first step toward analyzing website traffic like a pro.
-
Users: This is the number of distinct individuals who stopped by your site. Modern analytics tools are smart enough to recognize a returning visitor, so a single user can be responsible for many different visits over a month or year.
-
Sessions: Think of a session as a single visit. It starts when someone lands on your site and ends after 30 minutes of inactivity. One user can rack up multiple sessions if they keep coming back.
-
Pageviews: This one's pretty straightforward, it's the total number of pages viewed on your site. If one user visits three pages in a single session, that's three pageviews.
-
Engagement Rate: This is a crucial metric in 2026. It measures the percentage of sessions where a visitor stayed for longer than 10 seconds, triggered a conversion event, or viewed at least two pages. It's the modern replacement for "Bounce Rate," telling you how many people are actually interacting with your content.
These four metrics don't live in isolation; they paint a picture together. For example, seeing a high number of users but a low number of sessions per user might mean you're great at attracting new people, but not so great at getting them to return.
Before we go deeper, here's a quick reference table to keep these straight.
Essential Website Traffic Metrics and What They Mean
This table is your quick-reference guide to the core metrics you'll find in most analytics reports and the user behavior they represent.
| Metric | What It Measures | What It Tells You |
|---|---|---|
| Users | The number of unique individuals who visited your site. | Your total audience size or reach over a specific period. |
| Sessions | A single period of a user's activity on your website. | How frequently people are visiting your site. |
| Pageviews | The total number of pages viewed on your site. | The overall volume of content consumption. |
| Engagement Rate | The percentage of sessions that were actively engaged. | How compelling and interactive your site experience is. |
Think of this as your cheat sheet. When you're looking at a report, you can quickly glance back here to remember what each number truly signifies about your visitors.
Connecting Metrics to Real-World Scenarios
Data is just a bunch of numbers until you apply it to a real situation. That's when it becomes powerful.
Let's say you just launched a big ad campaign for a new product. You log into your analytics and see a massive spike in Users and Pageviews on the campaign's landing page. Awesome, right?
But then you dig a little deeper. The Engagement Rate for that same page is a dismal 12%. That's a huge red flag.
The data is screaming that while your ad is doing a great job driving clicks, the landing page is completely failing to deliver on its promise. There's a major disconnect between what people expected and what they found.
This single insight is pure gold. It tells you to pause the ad spend immediately and get to work fixing that landing page. Is the headline confusing? Is the call-to-action hidden? Maybe the page is just too slow to load.
By looking at how these metrics interact, you've gone from simply watching traffic numbers to diagnosing a critical business problem. This is what effective website traffic analysis is all about.
Discovering Where Your Best Visitors Come From
To really get a handle on your website traffic, you need to think like a digital detective. The goal isn't just counting how many people show up, but figuring out who your best visitors are and the exact paths they took to find you. This is where breaking down your traffic by its source becomes an incredibly powerful tool.
Picture your website as a popular local spot. People arrive from all over, some drove straight there because they already knew it, some were referred by a friend, and others saw a billboard on the highway. Each group has a different story, and understanding those stories is the key to attracting more of the right people.
Pinpointing Your Top Traffic Channels
Your analytics platform will neatly sort your visitors into several key channels. Each one tells you something unique about your marketing and what your audience is actually doing.
-
Organic Search: These are the folks who found you through a search engine like Google. High organic traffic is a fantastic sign that your content and SEO efforts are paying off.
-
Direct: This group knows you by name. They typed your URL right into their browser or used a bookmark, which points to strong brand recognition and loyal customers.
-
Referral: Someone clicked a link on another website to get to yours. This is pure digital word-of-mouth and can uncover powerful partnerships or content that's getting noticed.
-
Social: This is all the traffic coming from platforms like LinkedIn, Threads, or Instagram. It's a direct measure of how well your social media strategy is driving people to your site.
-
Paid Search: These visitors clicked on one of your paid ads, like a Google Ad. This channel needs a close eye to make sure you're getting a solid return on your ad spend.
Let's say you notice a sudden spike in your Referral traffic. You do a little digging and discover an old blog post of yours was just featured in a popular industry newsletter. This isn't just a random blip; it's a golden opportunity. You now know that this kind of content hits the mark with that specific audience, giving you a clear roadmap for future articles and outreach.
The real magic happens when you stop looking at traffic as one big number and start seeing it as a collection of distinct journeys. Analyzing these paths reveals which channels deliver not just visitors, but your future customers.
Leveraging Demographics and Device Data
Beyond just the source, understanding the "who" and "how" of your visitors unlocks another layer of optimization. Two of the most valuable data points here are your visitors' location and the type of device they're using.
Knowing where your visitors are coming from geographically can help you tailor your messaging. For instance, if you see a growing audience from a new country, you might think about adding region-specific content or promotions to better serve them.
Device type is just as crucial. With mobile usage continuing to dominate the web, your site's performance on smaller screens is non-negotiable. As of 2026, mobile devices account for approximately 68% of global web traffic, a figure that has continued its steady climb year over year. This massive share means a mobile-first approach isn't just a nice-to-have; it's essential for survival and growth.
If your data shows that 80% of your social media traffic is on mobile but they have a low engagement rate, that's a flashing red light that your mobile landing pages need some work. These insights allow you to make precise, data-driven improvements that have a real impact on your bottom line. And for tracking those paid campaigns, using a tool like our free UTM campaign link builder ensures your data is clean and accurate right from the start.
Turning Traffic Data Into Actionable Growth Strategies
All that data you've collected is just a pile of numbers until you actually use it to make better decisions. This is where the real fun begins, connecting the dots between what your analytics are telling you and what you should do next. We're moving from just watching the numbers to actively optimizing, turning raw insights into real, tangible growth.
The first step is figuring out which pages are your heavy hitters. I'm not just talking about the ones with the most pageviews. I mean the pages that actually drive your business forward, your pricing page, a blog post that converts like crazy, or that all-important "request a demo" form. Once you know which pages are doing the work, your mission becomes crystal clear: get more of the right people to them.
Mapping the User Journey to Find Friction
One of the most powerful things you can do is dig into user flow reports. Think of these reports as a GPS for your website, showing you the exact paths visitors take from the moment they land to the moment they leave. This is where you'll find the leaks in your conversion funnel.
Let's walk through a real-world scenario. You're looking at a user flow report in Humblytics and you spot something that makes your stomach drop. A huge chunk of visitors land on your homepage, click over to your services, and then hit the pricing page. But then... 85% of them just vanish. They exit right from the pricing page without taking any action.
This isn't just a number; it's a massive red flag. Your pricing page is a major drop-off point, acting like a roadblock in your customer's journey.
This drop-off isn't a random event. It's a clear signal that something on that pricing page is causing confusion, hesitation, or friction. Your job is to become a detective and figure out what it is.
This discovery is your launchpad for a series of targeted experiments. To come up with strategies that truly move the needle, you'll need a solid grasp of user experience design fundamentals, because UX is at the heart of how people interact with your site. Now you have a data-backed reason to investigate and test some changes.
From Diagnosis to A/B Testing
With the problem staring you in the face, you can start forming a hypothesis. Maybe your call-to-action is weak? Are the pricing tiers confusing? Or perhaps the page is missing the social proof needed to build trust with potential customers.
Based on that, you could set up a few A/B tests right inside Humblytics:
-
Version A (Control): Your current pricing page.
-
Version B (Test 1): Tweak the CTA copy from "Sign Up" to something more compelling like "Start Your Free Trial."
-
Version C (Test 2): Add a row of customer logos and a few powerful testimonials right above the pricing table.
By running these tests, you're officially done with guesswork. You're using real data to systematically improve the user experience and nudge more visitors toward converting. You've just turned a simple traffic metric into a powerful engine for business growth.
Answering Your Most Common Website Traffic Questions
When you first start digging into website traffic, it's easy to feel like you've opened a can of worms. You've got all this data, but what does it actually mean? If you've ever stared at a report wondering what to do next, you're in good company.
Let's clear up some of the most common questions people have when they start tracking their traffic.
How Often Should I Actually Check My Website Traffic?
One of the first things people ask is how often they should be looking at their numbers. Obsessively checking stats every single day is a recipe for anxiety and can lead you to overreact to tiny, meaningless dips and spikes.
For most businesses, a weekly check-in is the sweet spot. It's frequent enough to spot new trends as they emerge, but it gives you enough data to see real patterns instead of just daily noise.
Of course, there are exceptions. If you've just dropped a new product or you're in the middle of a big ad campaign, you'll want to switch to daily monitoring. This lets you make quick, smart adjustments on the fly, potentially saving your budget or capitalizing on a wave of early momentum.
Beyond those weekly pulse checks, make time for a comprehensive monthly review. This is your chance to zoom out, look at the bigger picture, and see how you're tracking against your actual business goals.
The perfect frequency isn't a magic number, it's about matching your analysis to your business activity. A quiet week might just need a quick glance, while a high-stakes launch demands your full attention.
What Is a Good Engagement Rate?
This is the classic "how long is a piece of string?" question. The honest answer? It depends.
A "good" engagement rate is completely contextual. It changes wildly depending on your industry, where your traffic is coming from, and the type of content they're looking at. A blog post and a checkout page will have totally different engagement metrics, and that's perfectly fine.
Instead of chasing some vague industry benchmark, focus on what really matters: improving your own historical data.
A sudden, sharp drop in engagement on one of your key landing pages is a much more useful signal than seeing how your numbers stack up against a competitor's. That's a sign you can actually do something about.
My Website Traffic Dropped Suddenly. What Should I Do?
Okay, first thing's first: don't panic. A sudden traffic drop feels scary, but a methodical approach will get you through it far better than a frantic one.
Here's what to do:
-
Check Your Tracking First: Before you assume the worst, make sure your analytics tracking code is still installed and firing correctly across your site. Sometimes the problem is just a technical glitch.
-
Look at Search Console: Head over to Google Search Console and check for any manual actions, security issues, or major crawl errors. These are often the culprits if your site has vanished from search results.
-
Analyze the Source: Pinpoint exactly where the drop happened. Did your organic search traffic fall off a cliff? Did a specific social media campaign just end? Isolating the source is the key to diagnosing the root cause instead of just guessing.
By following a systematic process like this, you can turn a stressful event into a solvable problem.
Ready to move beyond guesswork and see exactly how your visitors behave? Humblytics gives you privacy-first analytics, visual funnels, A/B testing, and heatmaps, all without cookies or consent banners. Start turning your traffic into revenue today.
Delete your cookie banner. Keep your data.
Cookie-free. No consent banner. 36KB script. Replaces GA4 + Hotjar + VWO without re-tagging a single page.